There are a lot of personal finance related calculators out there, but there are only a handful that I would recommend using on a regular basis. Here are a few of my favorite tools that have easy to use options and clear results.
Rent vs Buy Calculator : New York Times
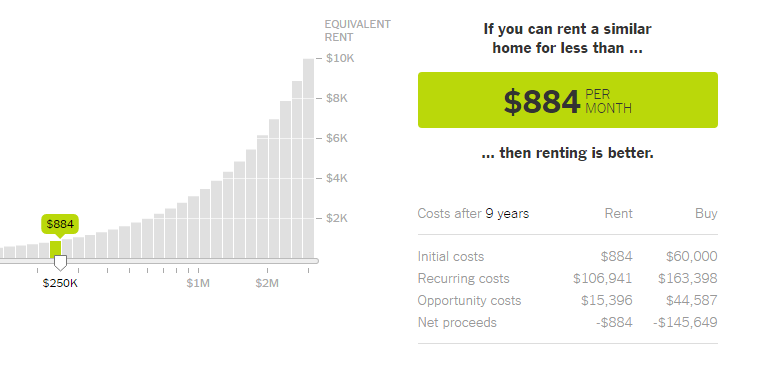
This rent vs buy calculator balances all the costs you could thing of related to buying a home versus the monthly rental costs. One of this calculator’s great features is that it accounts for the opportunity cost of the mortgage down payment. The opportunity cost is the cost of what you could have earned from that money if you hadn’t bought the house. The calculator also builds in costs to account for rising rent prices, home appreciation, and inflation. Also, the controls are easy to adjust how long you plan on staying and your home price budget. I know it sounds like a lot of options, but if you aren’t sure about one of them just leave it at the default value.
Vanguard Retirement Income Calculator
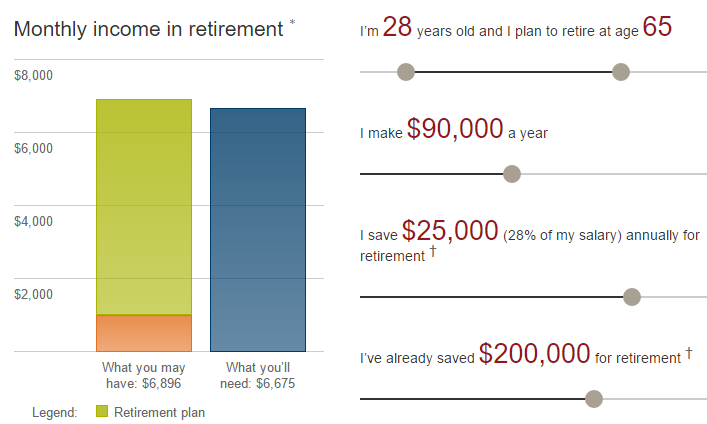
This is my go to retirement calculator. I use it as a simple and quick check to make sure that my savings rates are high enough to meet my retirement goals. The calculator is completely free and doesn’t require registration or anything like that. It automatically does not include Social Security, so you have to manually key in a number for that. In general, I like to pretend that Social Security will be tiny by the time I retire. I just put in $1,000 a month at most ($2,000 if you’re married) for a very conservative estimate of how much SS would actually pay out.
When can I retire? : Networthify
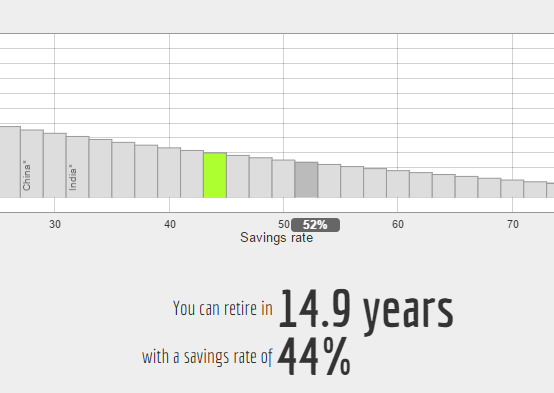
This calculator has pretty similar results to the previous Vanguard one, but it’s tilted more for figuring out how quickly you can retire. I really like the chart on this one, and that it emphasizes controlling spending in order to retire more quickly.
Savings Rate Calculator : Physician on Fire
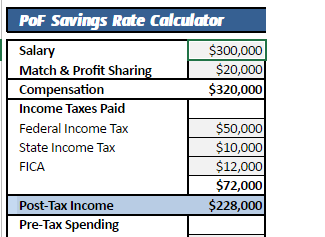
This is a great spreadsheet to help you understand that components of your savings rate in order to calculate it. It’s not as spiffy as some of the other tools, but it’s pretty straightforward and has a very detailed breakdown of how to tally up your income and savings.
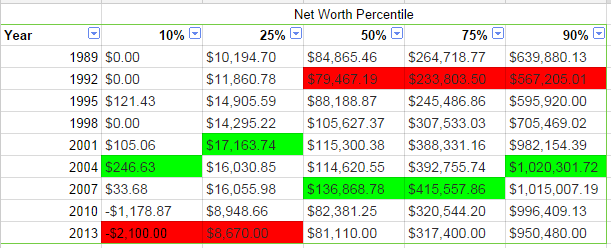
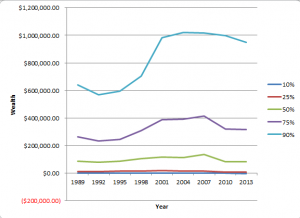 For further reference here are those same numbers plotted to show the relative changes in wealth between Americans at the 10th, 25th, 50th, 75, and 90th percentiles. The largest gains in the last couple decades have captured at the 10% and presumably above. I am hesitant to calculate and publish the numbers of the 5th and 95th percentiles because the data is a lot more prone to being skewed at the long tail ends of the distributions.