Category Archives: Anything

Data Science Boot Camp: Will it be Worth It?

I’ve been feeling an itch to learn new things in a more formal setting. There’s a lot of options from self learning, graduate school, and, recently, boot camps. I’ve been seeing a lot of ads for Data Science boot camps as an alternative to a traditional 1-2 year masters program, so I decided to investigate.

Continue reading Data Science Boot Camp: Will it be Worth It?

Learning Experiences from Going Viral (134k users in 1 day!)

Over the last 2 years, I’ve gone viral twice, most recently with a Reddit post that went way beyond my expectations. I had just wrapped up a months worth of work experimenting with some new data on savings rates, and I wanted to show off to /r/DataIsBeautiful. Data is Beautiful is a subreddit where analytical redditors post interesting graphs and charts. The nice thing about Data is Beautiful is that they allow original content, so that people like me (/u/shnugi_) can self post.  Most subreddits ban self posting, because it invites a deluge of spam.

I thought that I would get maybe a few hundred people to check out my data and give some constructive feedback. Well, this happened:

Went viral via reddit post.
134,752 sessions in a single day. My highest day ever.

The post I had made had attracted hundreds of comments and a Reddit score of 9898. Over ONE HUNDRED THOUSAND PEOPLE visited that day.

Dark Side of Going Viral – My Server Was Not Ready

Reddit #19 r/all
This is a screenshot my SO sent me of the post hitting #19 on r/All. It might have gone higher, but we were busy trying to fix the server.

I had a plan to be able to support a similar size of visitors as the Lifehacker feature (21k sessions in one day). My plan totally worked, until I completely blew past 21k sessions.  After that, my server was throttled for the next few hours.  My SO is much better than me at techy things, so I called in the reserves for help. We tried a bunch of things like resizing my Digital Ocean droplet, increasing PHP and MySQL memory limits, and then finally increasing the number of concurrent connections on Apache. The last one fixed the problem for me and my site resumed to normal speed, while also supporting over 1200 active users at the same time.

What I learned

  1. Have an even bigger plan next time.
  2. Load test my server to test the bigger plan, so that it isn’t like a fire drill every time it happens.
  3. Don’t be afraid of sharing. Typically, I shy away from self promoting, but it’s good to have some positive feedback when I do self promote that people like what I make.

Hopefully, someone finds this helpful.  For me, I know both the times that I’ve gone viral I’ve been highly under-prepared.  Good luck to all the other content creators out there!

38% of US Households Spend More Than Income


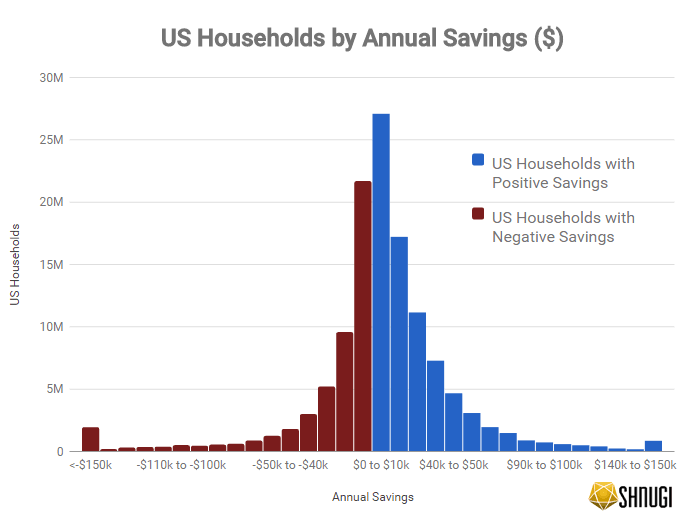
According to data from the 2015 Consumer Expenditures Survey by the Bureau of Labor Statistics, nearly 38.5% of US households spent more than they earned. Overall, 49.4 million out of 128 million US households are estimated to have had expenditures that exceeded their after tax income (table below). Another 21.1% (27.1 million) of US households saved less than $10,000 per year. One interesting fact is that 8.9% (11.3 million) US households are able to save at least $50,000 per year which is roughly equal to the median US household income.

Hover or click on the graph for more information.

The original Consumer Expenditures Survey considers retirement contributions as an expense, and even with adjusting those into savings 37.5% of households still spent more than they earned. Recently, there have been many studies reiterating the lack of savings that Americans have on had for emergencies. This data aligns with those earlier views on the poor health of the average American’s finances.

Source Data and Methodology

These results are calculated using the 2015 Bureau of Labor Statistics (BLS) Consumer Expenditures Survey (CEX) microdata. The microdata has survey results for a sample of 30,000 US households which are used to estimate the spending and income of the total US population. The data is weighted on a variety of factors by the Bureau of Labor Statistics so that the households sampled model reality. I used the pre-built SAS macro for the 2015 data to merge the interview with the diary files and aggregate expenditures by survey household unit. The interview and diary don’t link on a 1:1 ratio, so I allocated the diary expenditures across each survey household in the interview files. Each survey household was allocated a variable amount from the diary expenditures based on the household unit’s income, expenditures reported in the interview files, and population weight. I also took steps to ensure that the rolled up results still matched the published statistics on the BLS.

Annual Savings Amounts Table

Households Unadjusted : 38.5% of US households spent more than they earned in 2015. This was calculated using the CEX total annual expenditure by household. The CEX lumps all retirement contributions (401k, pensions, TSP) into expenditures. Household annual savings calculated as : [Estimated Pre-Tax Income] – [Estimated Taxes] – [Estimated Expenditures]

Households Adjusted : Adjusted for retirement contributions, 37.5% spent more than they earned in 2015. This was calculated using CEX total annual expenditure minus household retirement contributions by household. Social Security is still included in the expenditure values. Household annual savings calculated as : [Estimated Pre-Tax Income] – [Estimated Taxes] – [Total Estimated Expenditures] + [Total Estimated Retirement Contributions].

Annual Savings  Households (unadjusted)  Households (adjusted)
 <-$150k       1,994,856            1,867,628
 -$150k to -$140k          232,678                242,359
 -$140k to -$130k          355,854                303,275
 -$130k to -$120k          405,725                363,365
 -$120k to -$110k          429,066                411,577
 -$110k to -$10k0          553,061                513,501
 -$10k0 to -$90k          508,511                477,909
 -$90k to -$80k          593,815                581,473
 -$80k to -$70k          662,847                646,504
 -$70k to -$60k          919,974                932,389
 -$60k to -$50k       1,294,006            1,215,488
 -$50k to -$40k       1,851,218            1,833,831
 -$40k to -$30k       3,044,652            2,888,244
 -$30k to -$20k       5,260,480            5,229,834
 -$20k to -$10k       9,618,222            9,421,512
 -$10k to $0    21,733,884          21,187,798
 $0-$10k    27,128,611          26,860,088
 $10k to $20k    17,256,672          17,137,557
 $20k to $30k    11,193,070          11,312,717
 $30k to $40k       7,325,112            7,590,525
 $40k to $50k       4,709,618            4,965,180
 $50k to $60k       3,124,669            3,342,971
 $60k to $70k       1,994,672            2,250,973
 $70k to $80k       1,521,623            1,584,928
 $80k to $90k          929,844            1,064,559
 $90k to $100k          770,054                830,612
 $100k-$110k          632,352                659,814
 $110k to $120k          542,022                618,322
 $120k to $130k          450,592                484,008
 $130k to $140k          278,440                347,594
 $140k to $150k          219,223                217,597
 >$150k          901,936            1,053,230

If the interactive chart didn’t load for you, here is an image of the chart.
US Households by Annual Savings ($)

Related Topics

Savings Rate Ranking : This uses the adjusted savings rate calulation listed above to compare savings as a percentage of income.
Net Worth Rank by Age : This uses Survey of Consumer Finances data to calculate the net worth percentile rank depending on the age of the head of household.
Income Rank by Age : This uses Survey of Consumer Finances data to calculate the income percentile rank depending on the age of the head of household.

My 4 Favorite Personal Finance Calculators

There are a lot of personal finance related calculators out there, but there are only a handful that I would recommend using on a regular basis. Here are a few of my favorite tools that have easy to use options and clear results.

Rent vs Buy Calculator : New York Times

NY Times Rent vs Buy Calculator
This rent vs buy calculator balances all the costs you could thing of related to buying a home versus the monthly rental costs. One of this calculator’s great features is that it accounts for the opportunity cost of the mortgage down payment. The opportunity cost is the cost of what you could have earned from that money if you hadn’t bought the house. The calculator also builds in costs to account for rising rent prices, home appreciation, and inflation. Also, the controls are easy to adjust how long you plan on staying and your home price budget. I know it sounds like a lot of options, but if you aren’t sure about one of them just leave it at the default value.

Vanguard Retirement Income Calculator

Vanguard Retirement Calculator
This is my go to retirement calculator. I use it as a simple and quick check to make sure that my savings rates are high enough to meet my retirement goals. The calculator is completely free and doesn’t require registration or anything like that. It automatically does not include Social Security, so you have to manually key in a number for that. In general, I like to pretend that Social Security will be tiny by the time I retire. I just put in $1,000 a month at most ($2,000 if you’re married) for a very conservative estimate of how much SS would actually pay out.

When can I retire? : Networthify

When can I retire?
This calculator has pretty similar results to the previous Vanguard one, but it’s tilted more for figuring out how quickly you can retire. I really like the chart on this one, and that it emphasizes controlling spending in order to retire more quickly.

Savings Rate Calculator : Physician on Fire

Savings Rate Calculator
This is a great spreadsheet to help you understand that components of your savings rate in order to calculate it. It’s not as spiffy as some of the other tools, but it’s pretty straightforward and has a very detailed breakdown of how to tally up your income and savings.

Validating the Net Worth Percentile Calculator

With all the recent discussion on fake news. I want to take some time to go over some basic fact checking. Recently, it came to my attention that a certain website was publishing a number that said the average millennial had a negative net worth–this is false by the way. The author crudely extrapolated off of a handful of data points from the SCF and a WSJ article.

My Net Worth Percentile Calculator as well as the others all run off of the publicly available micro-data from the Federal Reserve’s Survey of Consumer Finances or Bureau of Labor Statistic’s Consumer Expenditure. I take great care to ensure that the results of the calculators would meet the same standards as the work I do in my day job as an analyst.

Comparison to Published SCF Stats

Here, are side by side comparisons from the Survey of Consumer Finances. I am using this Changes in U.S. Family Finances from 2010 to 2013: Evidence from the Survey of Consumer Finances to do the comparisons.

On page 12 these are the value’s calculated for median net worth by age from the SCF:

Click on the links to open the net worth percentile calculator for that age range.

Age Median Net Worth 2013
Less than 35  $                                 10,460
35-44  $                                 47,050
45-54  $                              105,600
55-64  $                              169,640
65-74  $                              229,800
Greater than 75  $                              194,700

As you can see, the totals from the calculator track very closely with the published statistics from the US Treasury.  The numbers do not match exactly, probably due to some differences in clean up that the US Treasury does for their official numbers versus what I do with the the raw data that they publish.